Unemployment at the municipal level in Czechia
(2002 – 2020)
This map application presents a visualization and analysis of the evolutionary dynamics of unemployment at the municipal level in Czechia from 2002 up to the present. The analysis is based on a yearly time series of unemployment data at a detailed territorial level of more than 6,000 municipalities, which makes it particularly suitable for a detailed investigation of the evolution of microregional differences and spatial impacts of the global economic crisis. In the application, the basic data of unemployment (number of job seekers, unemployment rate), the results of local spatial autocorrelation measures including identification of spatial clusters, and the complex typology of municipalities are presented.
During the post-totalitarian and post-industrial transformation, huge changes of regional differences and spatial patterns occured in Czechia. It applied for all societal phenomena including economic ones. In the last decade, a relative stability and an ongoing shift from macro-differentiation (across districts) to micro-differentiation (across municipalities) were detected. This map application presents a visualisation and analysis of the evolutionary dynamics of unemployment at the municipal level in Czechia in the long-term perspective, from 2002 up to the present. Unemployment rate was chosen as a complex economic characteristic available on this detailed spatial level. The empirical evidence of the evolution of socio-economic differentiation and insight into the dynamics of spatial differentiation at a local level is important for a detailed investigation of the topical trends including evaluation of the stability of spatial patterns of unemployment and the regional impacts of the global economic crisis.
In the map application, the official data on the number of unemployed people searching for jobs and registered at job centres are used. The Labour Offices reports the number of registered unemployed job seekers on the last day of each month. To avoid the problems with extreme values in tiny municipalities with a value of zero not being an exception, yearly averages based on monthly data were calculated. The unemployment rate is defined as the number of immediately employable job seekers in the 15 – 64 age group. Because of methodological changes in unemployment definition in previous years and the need of comparable data, the unemployment rate was recalculated according to this current definition for the whole time period from 2002 up to the present. For two years (2012 and 2013), the unemployment data at the municipal level are missing due to technical problems at the Labour Offices. Data on the number of people in the 15 – 64 age group is available from the Czech Statistical Office on the 31st of December each year. To gain yearly unemployment rates, average values were calculated from values related to the beginning and end of each year.
Czechia is characterized by a very fragmented structure of municipalities which represent the lowest level of local government. Namely, there are 6,254 municipalities (and four military areas without permanent inhabitants), which makes it particularly suitable for a detailed investigation. The median population of the municipalities is less than 500 inhabitants and the mean area is less than 13 square kilometers. To maintain territorial coherency, all data was recalculated in accordance with the current territorial structure (i.e. the administrative division valid at the end of 2019). It enables to compute indexes of changes for each municipality and explore the spatiotemporal tendencies in changes to the unemployment rate.
There are three different views on unemployment data in the map application:
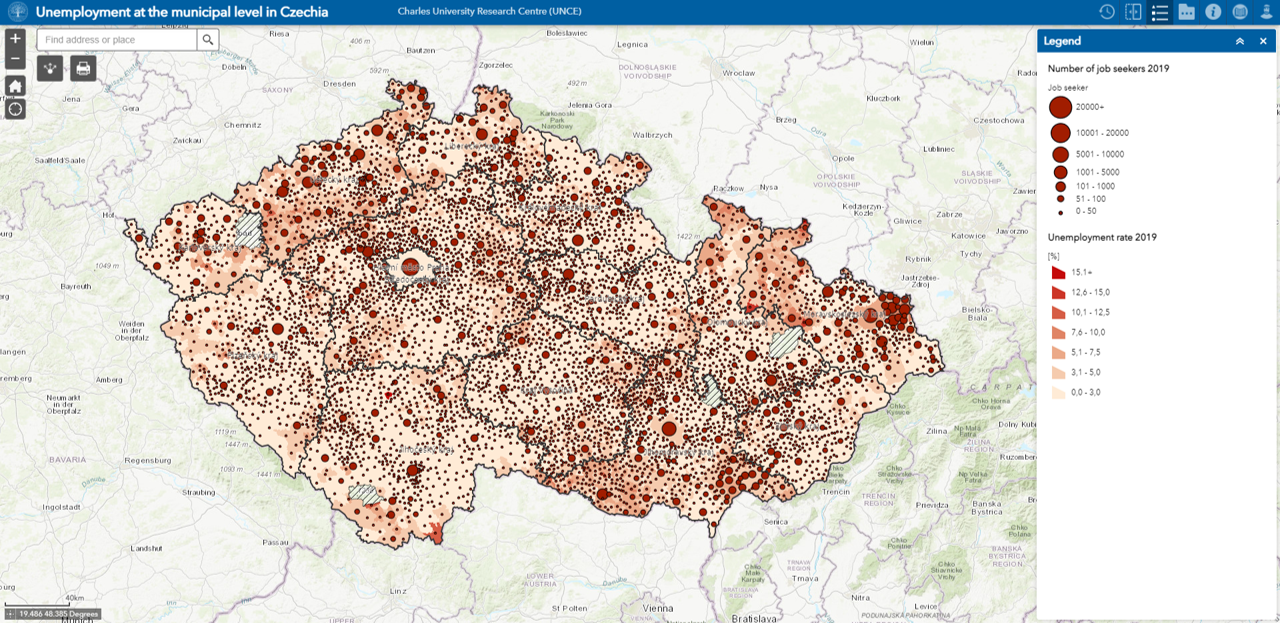
1) Registered unemployment
The number of registered unemployed persons (job seekers) and the unemployment rate is visualized for several chosen years from 2002 up to the present by simple graduated symbols and choropleth maps.
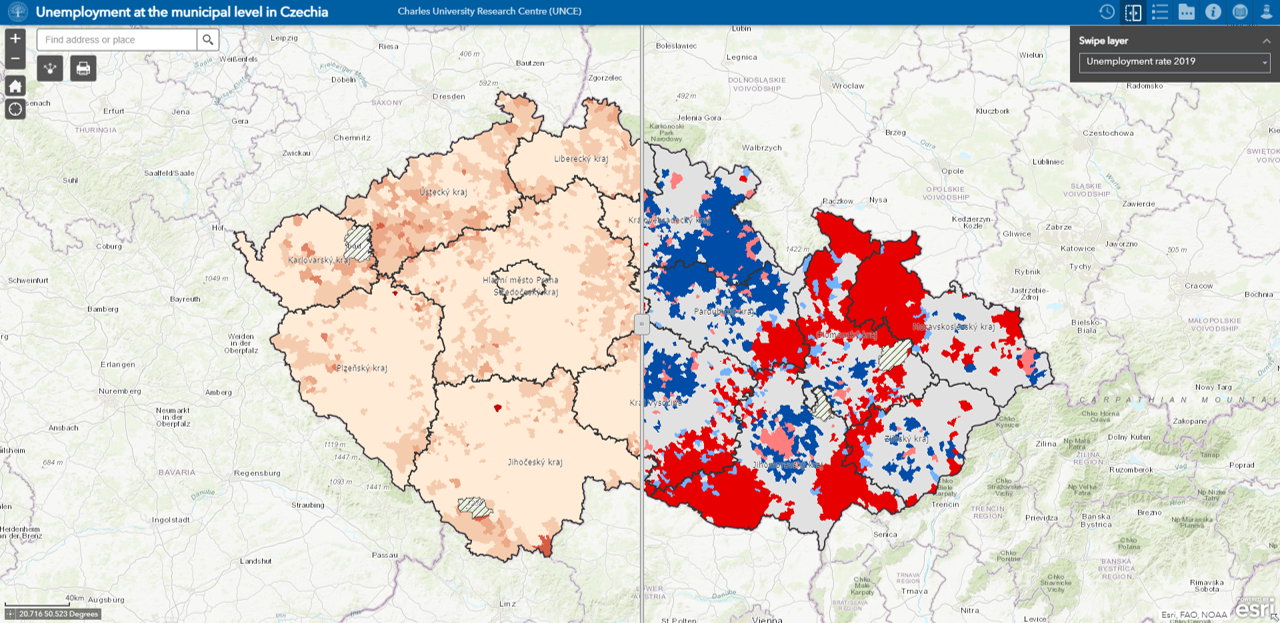
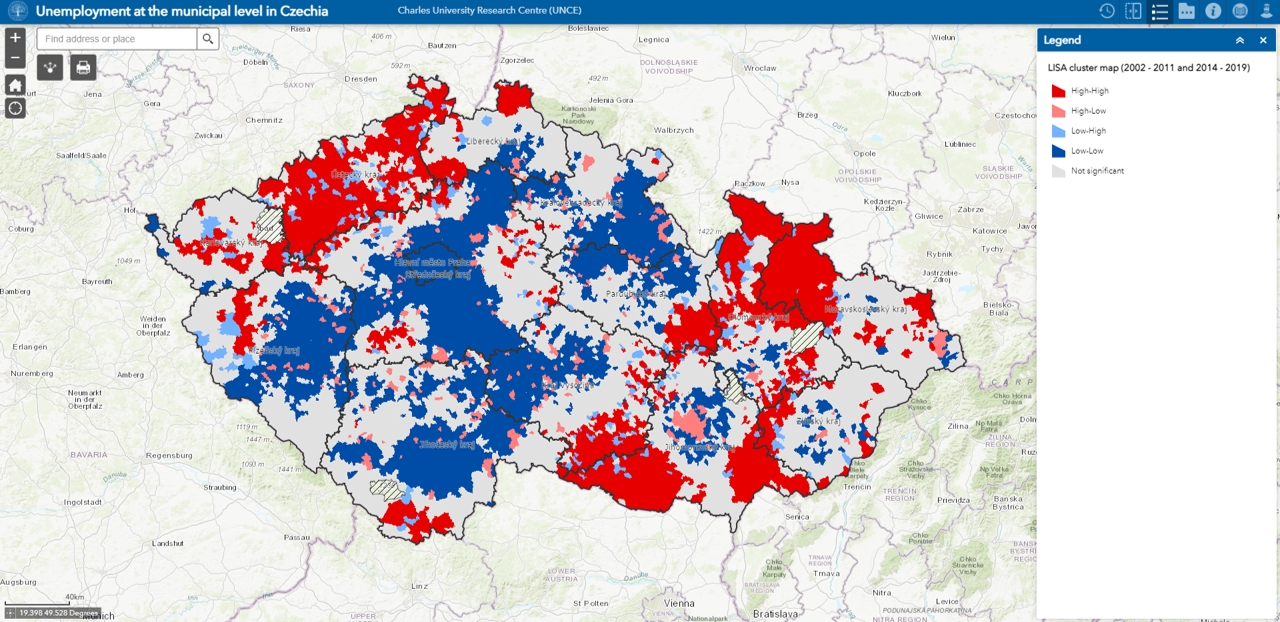
2) Spatial clustering of unemployment
The spatial patterns in unemployment are examined by local spatial autocorrelation measures. Namely, the local indicators of spatial association (LISA) are used to identify statistically significant spatial clusters of high or low values of unemployment and spatial outliers. For calculation of LISA analysis, a distance-based spatial weighting scheme with the cut-off distance of 10 km was applied. The statistical significance (at a significance level of 5%) was tested by 199 permutations. The cluster maps are presented by the time slider for all covered years (excluding missing data for 2012 and 2013).
3) Spatiotemporal trends of unemployment
The spatiotemporal trends in unemployment are examined by two analytical maps.
A) Spatial patterns of long-term hot spot analysis for unemployment
To identify long-term hot spots and cold spots of unemployment, the analysis of local autocorrelation measure, namely the Hot Spot analysis, is applied. First, hot spot analysis cluster maps for each year in the study period are calculated for the distance-based spatial weights with fixed Euclidean distance and a threshold distance of 10 km. Second, the values of Gi_Bin (Cold Spot 99% = -3, Cold Spot 95% = -2, Cold Spot 90% = -1, Not Significant = 0, Hot Spot 99% = +3, Hot Spot 99% = +2, Hot Spot 99% = +1) for all 16 years are summed up and visualised.

B) Changes to unemployment during the global economic crisis in relative terms
To reveal the distinctive trends or patterns in the evolution of unemployment during the economic crisis in detail, and to identify municipalities that were most affected by the crisis in terms of unemployment, the relative position of each municipality before the crisis (years 2006–2008, Czechia = 100%) and its change during the crisis (difference between 2006–2008 and 2009–2011, Czechia = 0%) are visualized. While units in a light shade represent municipalities with low unemployment rates before the crisis, units in green depict municipalities that succeeded in improving their relative position within Czechia during and after the crisis. Red indicates the worsening of a relative position of a municipality because of the crisis.

Authors of the application