Phantom border of Sudetenland
(1991 – 2021)
The Sudetenland border is often mentioned when interpreting spatial patterns of various socioeconomic phenomena even more than 70 years after the expulsion of Czech Germans and subsequent resettlement of the borderlands (Korčák, Netrdová 2022). We could hence consider it as an example of a phantom border in the Czech context that officially no longer exists, but still plays a significant role in current socio-spatial differentiation. However, the impact of the former Sudetenland border should not be perceived as direct, but in the sense of a primary factor, which could be further reproduced, strengthened, or weakened.
The aim of this map application is to visualize the impact of the former Sudetenland border as a primary factor on the socio-spatial differentiation of Czechia in time and space. The dimension of time includes comparison of four post-totalitarian censuses in 1991, 2001, 2011 and 2021. In order to closely examine the nearest surrounding of the border, the analysis is carried out at the municipality level. To maintain territorial coherency, all data was recalculated in accordance with the current territorial structure (i.e. the administrative division valid in 2021). Due to missing data, we do not work with the four military areas and the six municipalities that were created by separating from them. Therefore, out of a total of 6 258 municipalities, only 6 248 enter the analysis.
In the map application, the historical border of the Protectorate of Bohemia and Moravia based on the German majority population is fitted into the current municipal structure. The final Sudeten border thus respects the current municipal structure and the historical border of the Protectorate of Bohemia and Moravia. The fit is not 100% since there were some administrative changes in municipal delimitation (especially in the case of big cities); however, the differences are only minor, and they do not have a significant impact on our research goals. In addition, we have eliminated enclaves and exclaves to have two coherent regions split by one phantom border.
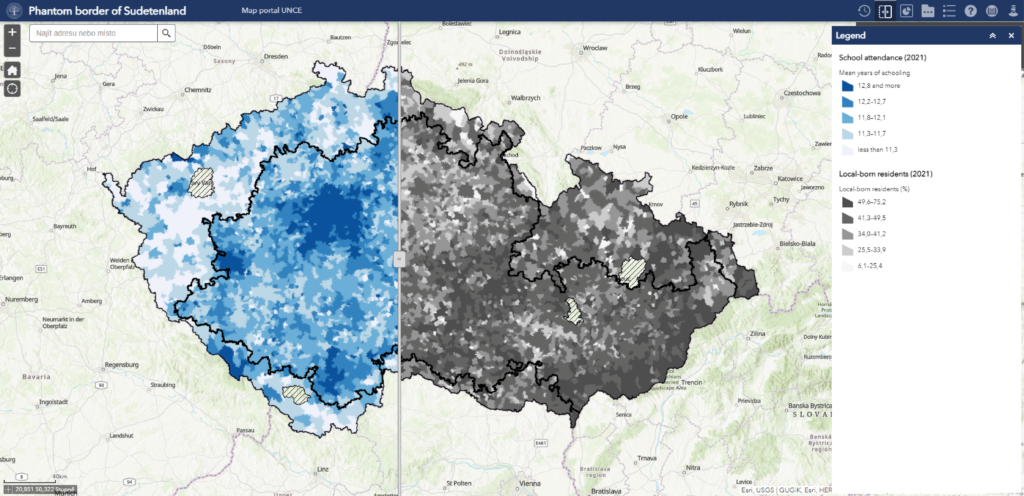
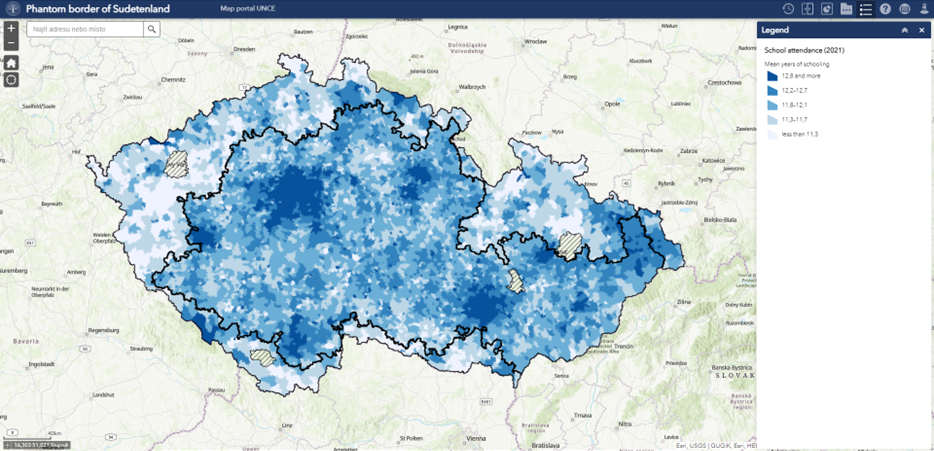
There are three groups of indicators that are analysed in relation to the former Sudetenland border in the map application. The choice is based on the fact that the forced migration after 1945 substantially transformed local regional structures. Firstly, the demographic structure is represented by mean age calculated from 5-year age groups. Secondly, the unemployment rate represents the economic structure. It is calculated by dividing the number of unemployed people by the total number of economically active people in the municipality. Thirdly, the social structure is further split according to Korčák and Netrdová (2022) into three concepts of social stability, human capital and regional identity. The concept of social stability is expressed by share of people born in the municipality of usual residence (local-born residents) and the migration turnover rate per 1,000 inhabitants (5-year average, respectively time-weighted average with the closest available years to the censuses in 1991 and 2021). Human capital is involved in the analysis through mean years of schooling (weight of education level: primary education including incomplete education = 7, secondary education without high school diploma = 11, secondary education with high school = 13, higher education = 18). Finally, regional identity is captured by voter turnout in local and regional elections held closest to a census date.
There are two different analytical approaches in the map application:
1) Firstly, the effect of the border is evaluated in a single year, in our case related to a day when a census was held. Five indicators representing each structure and concept are chosen – mean age, unemployment rate, local-born residents, local elections voter turnout and school attendance. Spatial pattern of each of the indicators is visualized through a choropleth map for the first and the last census for which data are available (i.e. censuses 1991 and 2021).
2) Secondly, to reveal the spatiotemporal trends in the effect of the former Sudetenland border, the analysis of local autocorrelation measure, namely the Hot Spot analysis, is applied. Hot spot analysis cluster maps for each census year in the study period are calculated for the distance-based spatial weights with fixed Euclidean distance and a threshold distance of 10 km. There are used the same indicators as in the choropleth maps. The only exceptions are concepts of social stability and regional identity, where the average of the z-scores of all above mentioned indicators (including migration turnover rate, respectively regional elections voter turnout) enters the hot spot analysis as a synthetic indicator.
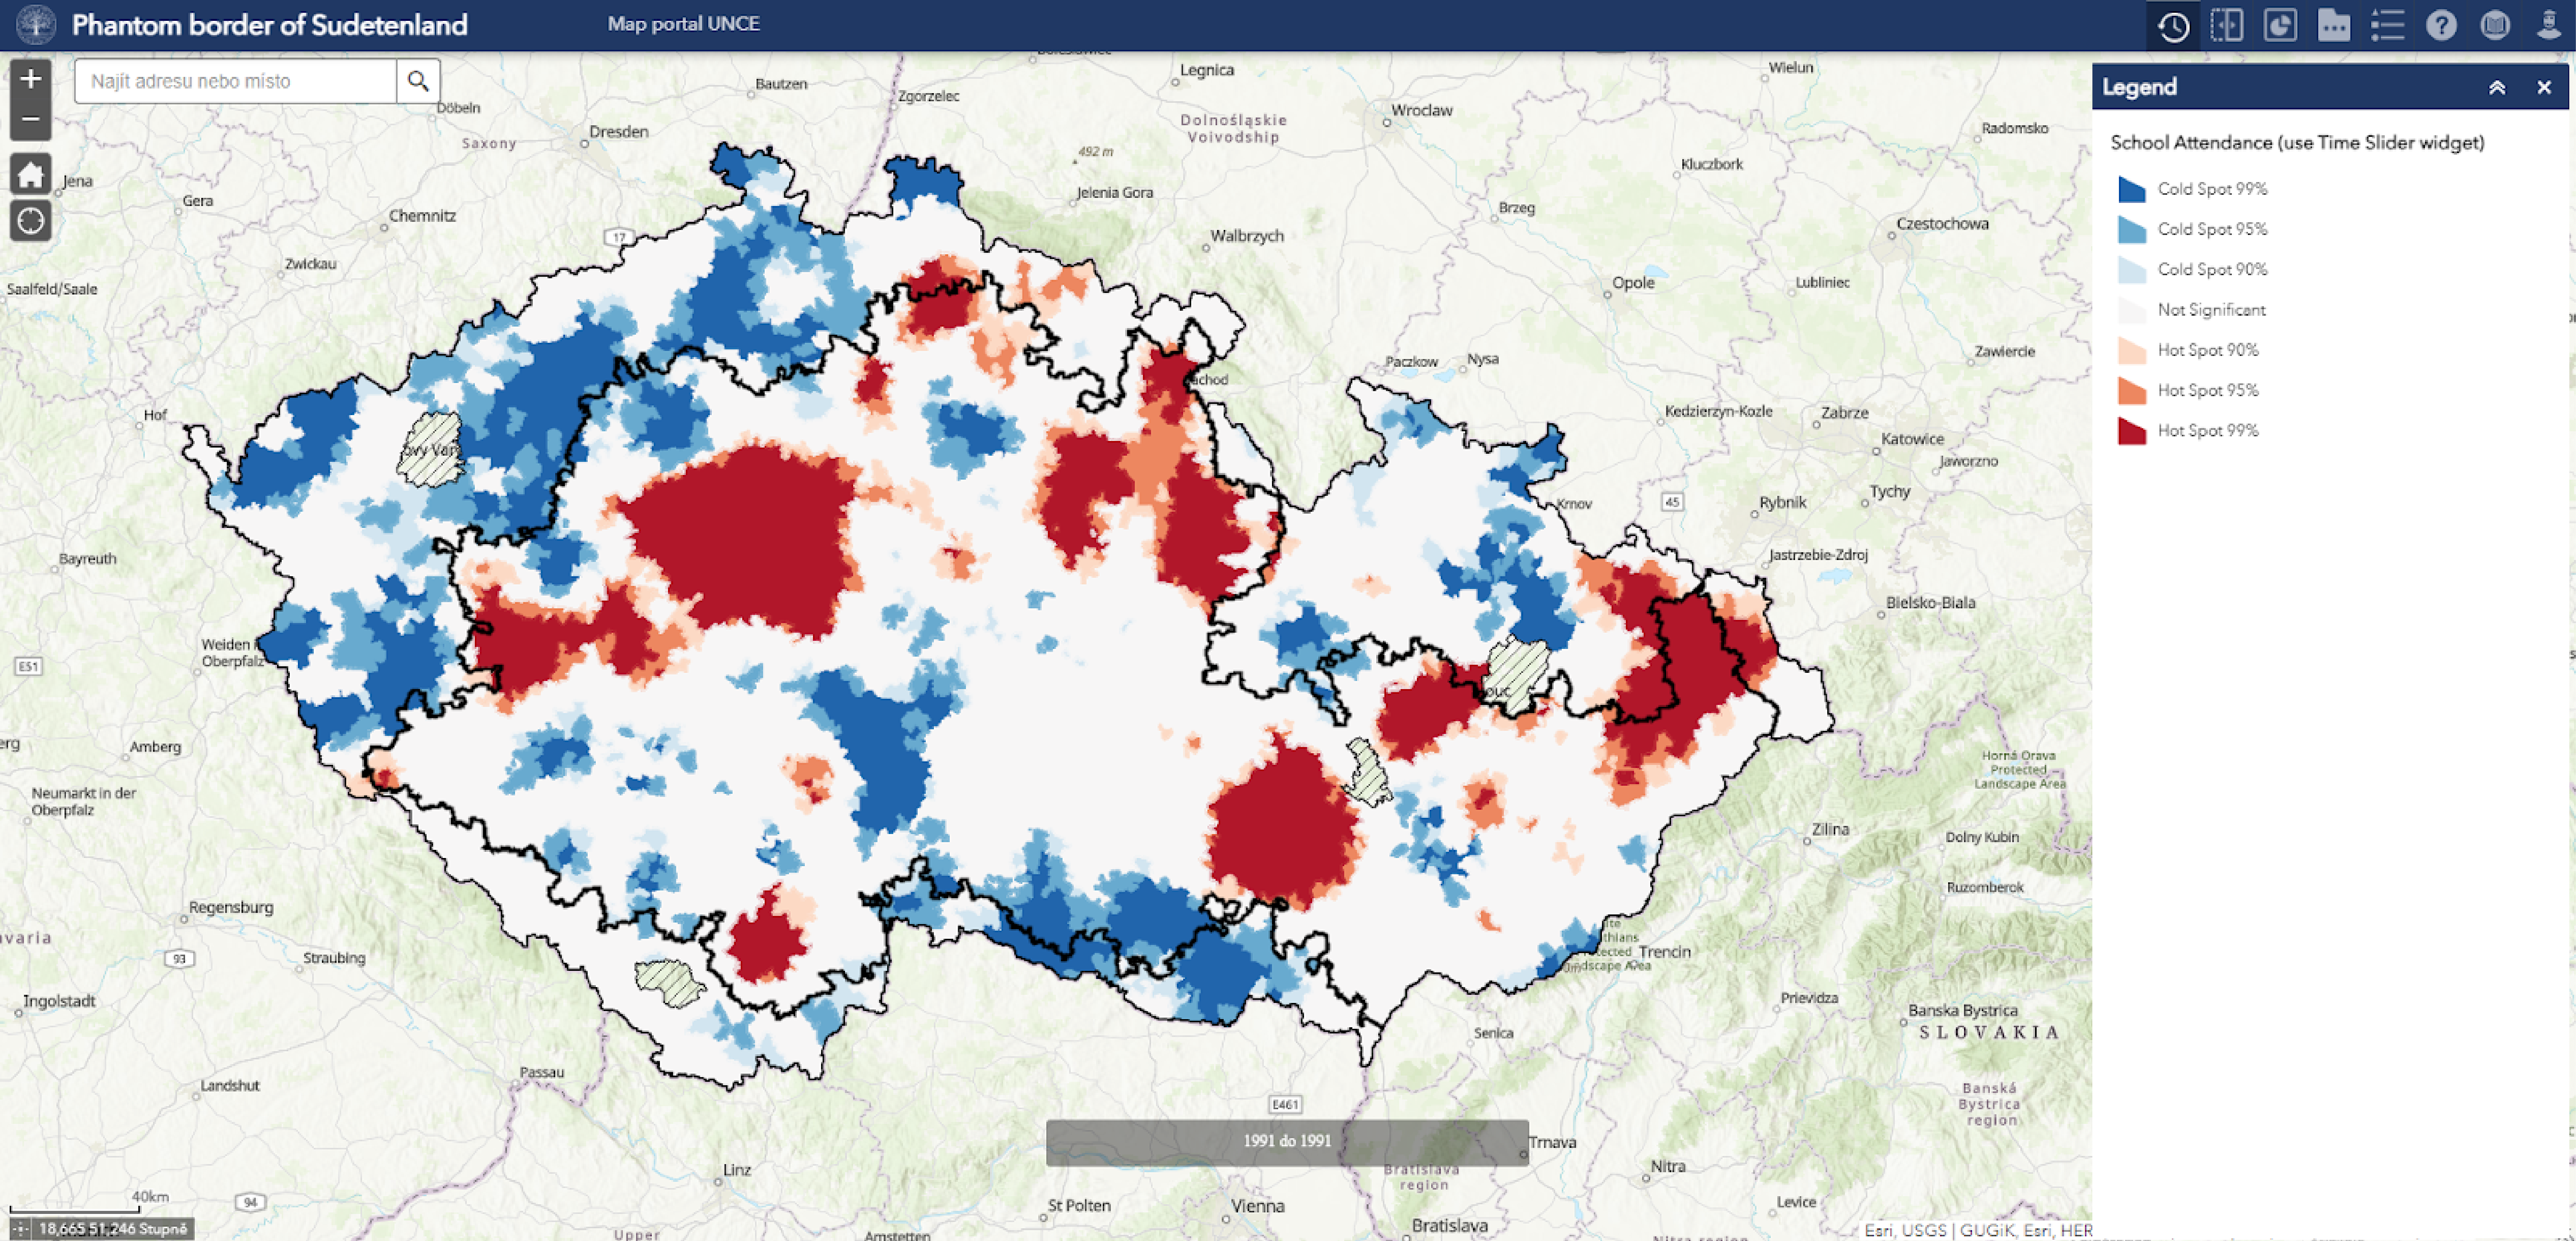
The size of the effect of the phantom Sudetenland border is measured by Cohen’s d, which allows us to quantify temporal changes. The values for the five synthetic indicators are visualized in the supplementary interactive chart.
Authors of the application

Mgr. Matěj Korčák
author of the Phantom border of Sudetenland application
RNDr. Pavlína Netrdová, Ph.D.
author of the Phantom border of Sudetenland application