The Epidemiological situation of COVID-19 in Europe
(2020)
Běžně vykazované hodnoty míry smrtelnosti (Case Fatality Rate) jsou často interpretovány ve smyslu rizika úmrtí nakažených osob, resp. závažnosti onemocnění. Tato intenzita je však v běžně konstruovaném ukazateli (podíl zemřelých na 100 registrovaných případů za stejné období nebo ke stejnému dnu) více či méně ovlivněna věkovou strukturou (potvrzených) nakažených osob. Věková struktura potvrzených případů COVID-19 (prezentovaná např. podílem osob ve věku 65 a více let mezi potvrzenými případy) se ale mezi státy výrazně liší a je proměnlivá i v čase, pro srovnání smrtelnosti v rámci různých populací (různých států, ale i jednoho státu v různých časových obdobích) se víc hodí tzv. standardizovaná míra fatality/smrtelnosti. Intenzita smrtelnosti je v něm aplikována na tzv. standardní věkovou strukturu a výsledné hodnoty jde tedy vzájemně mezi různými populacemi porovnávat, neboť standard je pro všechny zvolen jednotně. V prezentovaném příkladu je za standard zvolena průměrná věková struktura potvrzených případů COVID-19 v 16 evropských státech, která odpovídala 100. dnu od 100. registrovaného případu v každém z těchto států. Hodnoty pak lze interpretovat tak, kolik úmrtí by v průměru připadlo na 100 registrovaných případů onemocnění v dané populaci, pokud by věková struktura registrovaných případů odpovídala zvolenému standardu.
The aim of this application is to present such measures, which are more suitable for international comparison and comparison in time – the standardized Case Fatality Rate adjusted for the differences in the age-structure of the confirmed cases.
There are three particular layers of the map – Observed Interval Case Fatality Rates, Age-standardized Interval Case Fatality Rates, and Share of the Age Group 65+ Among Confirmed Cases. The values cover a period of 150 days from the day of confirmation of the 100th case of COVID-19 in each country. The whole period is studied using three 50-days periods – Period 1 (day 1–50), Period 2 (day 51–100), and Period 3 (day 101–150). For the Case Fatality Rates (CFR) also the age groups are distinguished – ages below 65, ages 65 and more. Moreover, the measures are presented for the complete age-range too.
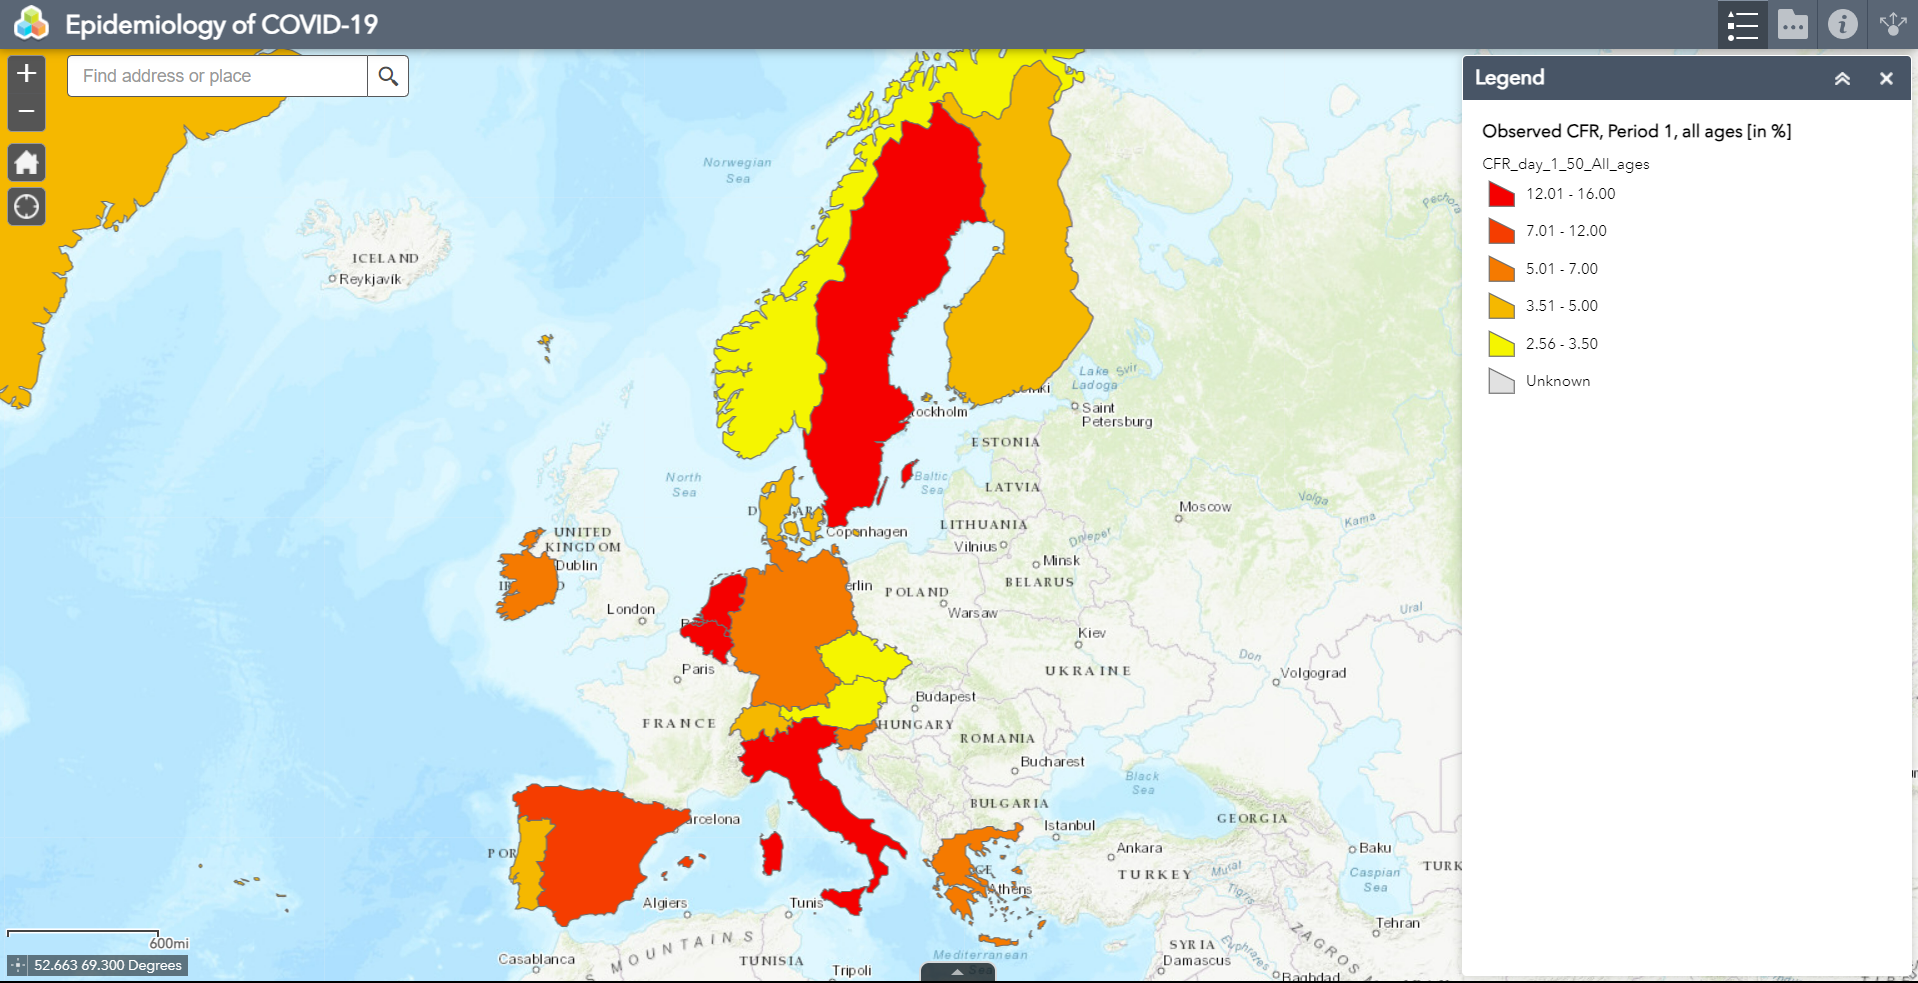
Observed CFR
The Observed CFR represent the values which could be usually found in general databases or dashboards related to the current pandemic. It is defined as:

Where D stands for the cumulative number of registered deaths and C for the cumulative number of registered cases. Its values could be presented as in % or per 100 confirmed cases.
As was proved, values of this measure are significantly affected by the age structure of confirmed cases. Because of that, the observed CFRs cannot be directly used for comparison in time (the age structure of the confirmed cases develops and changes in time) as well as across the populations (because the age structure of the confirmed cases differs significantly in particular countries). This important disadvantage could be solved by calculation and usage of the Age-standardized CFR.
Age-standardized CFR
The Age-standardized CFR is calculated using the method of standardization. It is based on replacing the empirical age structure by a standard one what eliminates the effect of various and time changing age structures of confirmed cases:

is the number of confirmed cases of the illness in the age group x and
is the age-specific case fatality rate corresponding to the same age group. System of values of
represents the age structure of the population with a confirmed infection. For standardization, this age structure is replaced by the standard age structure.
The age structure of the total (i.e. of all the analyzed countries as a whole) population with confirmed infection on the 100th day from the day of 100+ cases was used here as a standard.
Share of the Age Group 65+ Among Confirmed Cases
For an independent evaluation of the importance of the age-structure of confirmed cases for the summary measure as the CFR is, a map of the share of persons aged 65 and more years among the confirmed cases is included. Again, the proportion is showed for all the three above defined periods.
Conclusion
Over a million confirmed cases of COVID-19 from 16 European countries were observed during the first wave of the pandemic. Epidemiological measures like the case fatality rate (CFR) helps to determine the severity of the illness. However, such a measure is highly affected by the age-structure of the population with confirmed infection. Clearly, in countries with higher proportion of seniors among the confirmed cases the observed CFR reaches the highest values.
The correct cross-country comparison and evaluation of the national differences and observed trends is possible using the standardized CFRs, adjusted for differences in the age structure of confirmed cases.
More about the measures, e.g.: Hulíková Tesárková, K. (2020): Demographic aspects of the COVID-19 pandemic in Italy, Spain, Germany, and South Korea. Geografie, 125, 2, 139–170. https://doi.org/10.37040/geografie2020125020139
Source of Data: Riffe T, Acosta E, et al. COVerAGE-DB: COVID-19 cases and deaths by age database [Internet; cited 2020 Jul 12]. Available from: https://doi.org/10.17605/OSF.IO/MPWJQ
Authors of the application

prof. RNDr. Dagmar Dzúrová, CSc.
author of the The Epidemiological situation of COVID-19 in Europe application
RNDr. Klára Hulíková, Ph.D.
author of the The Epidemiological situation of COVID-19 in Europe application